Price_ActionCandlestick analysis
Here is a summary of candlestick analysis that seems useful.
pin bar
inside bar
outside bar
thrust bar
reversal bar
runway bar
morning star
evening star
hammer
inverted hammer
thank you for reading.
在腳本中搜尋"inside bar"
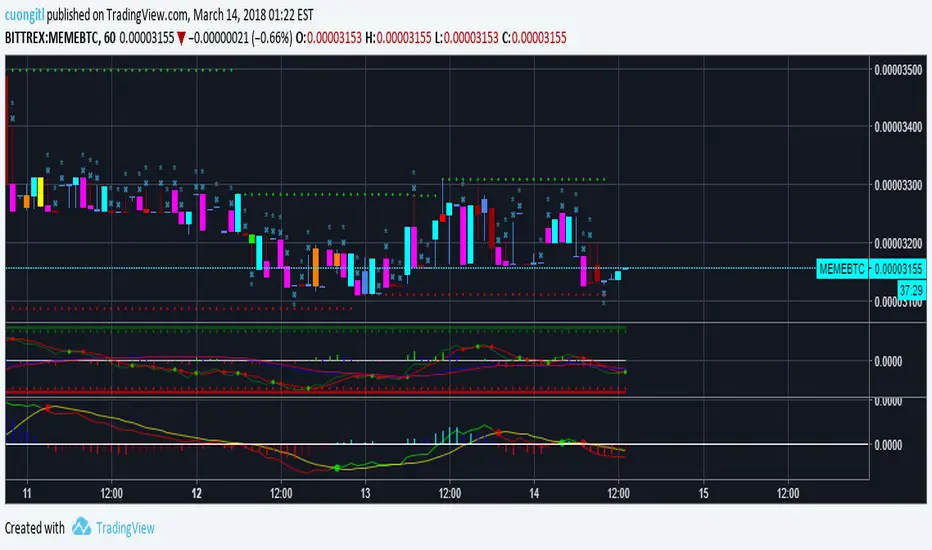
CryptoVN - Price Action Bard and Fractal*Mod version from "CM_Price-Action-Bars" by ChrisMoody and "Fractal Support Resistance (Fixed Volume) 2" by synapticEx
(*)Price Action Bars:
- Yellow = Inside Bar – Breakout Patterns
- Orange = Outside Bar – Breakout Patterns
- Green/Red = Pin Bars
- Aqua/Fuchsia = Shaved Bars
(*) Fractal Support/Resistance on current chart.
(*)My Advice to You:
- The Trend Is Your Friend. TRADE WHAT YOU SEE, NOT WHAT YOU THINK.
Good luck. ^^!
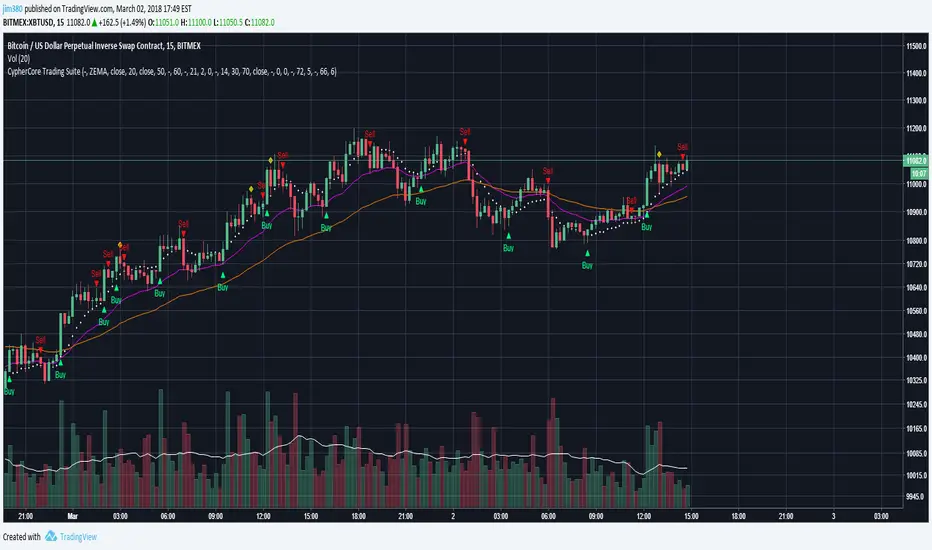
[STUDY] CypherCore Trading Suite
Rerband. Now a STUDY script.
- RSI overlay indicators (diamond shapes)
- Most commonly used MA types( i.e. SMA , EMA , WMA , VWMA , ZEMA )
- Bands
- Price Action Indicator (color coordinated)
color code:
yellow --- inside bars (breakout)
blue --- outside bars (breakout)
green --- up pin bars (reversal)
red --- down pin bars (reversal)
fuchsia --- down shaved bars (selling pressure, selling likely to continue)
aqua --- up shaved bars (buying pressure, buying likely to continue)
- Reversal candlestick patterns (only a few for now)
- Two strategies for determining buy/sell signals
1. buy/sell signals determined by EMAs crossover (better for position or swing trades)
2. buy/sell signals determined by MAs crossover (better for scalping)
03/02/2017
- Switched to STUDY
- Fractals added
- Alerts now fully working
- New "Input" menu
Buy/Sell signals are NOT financial advice.
Candlestick Trend Indicator v0.5 by JustUncleLRequested Update to this Indicator alert project. In this update I have added the option to be able select which Price Action candles you want included in the display and the generated alarm Alert. Other changes also included in this update:
Also added a Price Action candle for "Last Fractal S/R Break", this also a good continuation indication.
Added option to select a different moving average types for directional MA line.
Modified some default settings, using HullMA instead of Zero Lag EMA and standard MACD settings(12,26,9).
Description:
This is a trend following indicator and alert for Binary Options based on Candlestick patterns and trend line -
NOTE: original system was a forex trading system.
This code combines a number of indicators to create an overall trading strategy.
The indicator recognises and displays some useful candle named defined patterns that are used to support trend continuation:
Bearish + Bullish PinBars
Dark Cloud Cover
Piecing Line
Bullish + Bearish Harami
Bullish + Bearish Engulfing Candle
Bullish + Bearish Last Fractal S/R break
Also recognises main Price Action candles from ChrisMoody (CM), the four(4) price action patterns are colored coded bars:
Yellow = Inside Bar - breakout/continuance
Orange = Outside Bar - breakout/continuance
Aqua/Fuschia = Up/Down Shaved Bars - Buying/Selling pressure
Red/Green = Possible reversal PinBars - Reverse Down / reverse Up
The highlighted candles (maroon and darker green) represent the defined PA patterns that have been confirmed following the current trend direction that is indicated by the Hull MA(20) line (can select a different type of MA, or even disable) and confirmed by MACD direction (can be disabled). The confirmed Alerts are indication by green (buy) and red (sell) dots at the bottom of the chart. An alert is generated from this selection for the alert condition of the alarming system.
The fractal upper/lower break lines are also draw, if the (optional) last fractal break line is broken by a highlighted bar then this indicates a stronger trend conformation.
The MACD indicator MACD DEUTER 2 colour(12,26,9) you can visually see the MACD histogram colours with MACD direction - needs "MACD DEUTER 2 colour" indicator.
This multi-indicator set up is suitable for 1hr, 4hr and daily charts with 1-4 candle expiry.
References and Inspiration from:
Fractal Levels by RicardoSantos
Almost Zero Lag EMA
Candlestick Patterns With EMA by rmwaddelljr
CM_Price-Action-Bars by ChrisMoody
www.forexstrategiesresources.com
"Scalp Jockey - MTF MA Cross Visual Strategizer by JayRogers"

PivotBoss VWAP Bands (Auto TF) - FixedWhat this indicator shows (high level)
The indicator plots a VWAP line and three bands above (R1, R2, R3) and three bands below (S1, S2, S3).
Band spacing is computed from STD(abs(VWAP − price), N) and multiplied by 1, 2 and 3 to form R1–R3 / S1–S3. The script is timeframe-aware: on 30m/1H charts it uses Weekly VWAP and weekly bands; on Daily charts it uses Monthly VWAP and monthly bands; otherwise it uses the session/chart VWAP.
VWAP = the market’s volume-weighted average price (a measure of fair value). Bands = volatility-scaled zones around that fair value.
Trading idea — concept summary
VWAP = fair value. Price above VWAP implies bullish bias; below VWAP implies bearish bias.
Bands = graded overbought/oversold zones. R1/S1 are near-term limits, R2/S2 are stronger, R3/S3 are extreme.
Use trend alignment + price action + volume to choose higher-probability trades. VWAP bands give location and magnitude; confirmations reduce false signals.
Entry rules (multiple strategies with examples)
A. Momentum breakout (trend-following) — preferred on trending markets
Setup: Price consolidates near or below R1 and then closes above R1 with above-average volume. Chart: 30m/1H (Weekly VWAP) or Daily (Monthly VWAP) depending on your timeframe.
Entry: Enter long at the close of the breakout bar that closes above R1.
Stop-loss: Place initial stop below the higher of (VWAP or recent swing low). Example: if price broke R1 at ₹1,200 and VWAP = ₹1,150, set stop at ₹1,145 (5 rupee buffer below VWAP) or below the last swing low if that is wider.
Target: Partial target at R2, full target at R3. Trail stop to VWAP or to R1 after price reaches R2.
Example numeric: Weekly VWAP = ₹1,150, R1 = ₹1,200, R2 = ₹1,260. Buy at ₹1,205 (close above R1), stop ₹1,145, target1 ₹1,260 (R2), target2 ₹1,320 (R3).
B. Mean-reversion fade near bands — for range-bound markets
Setup: Market is not trending (VWAP flatish). Price rallies up to R2 or R3 and shows rejection (pin bar, bearish engulfing) on increasing or neutral volume.
Entry: Enter short after a confirmed rejection candle that fails to sustain above R2 or R3 (prefer confirmation: close back below R1 or below the rejection candle low).
Stop-loss: Just above the recent high (e.g., 1–2 ATR or a fixed buffer above R2/R3).
Target: First target VWAP, second target S1. Reduce size if taking R3 fade as it’s an extreme.
Example numeric: VWAP = ₹950, R2 = ₹1,020. Price spikes to ₹1,025 and forms a bearish engulfing candle. Enter short at ₹1,015 after the next close below ₹1,020. Stop at ₹1,035, target VWAP ₹950.
C. Pullback entries in trending markets — higher probability
Setup: Price is above VWAP and trending higher (higher highs and higher lows). Price pulls back toward VWAP or S1 with decreasing downside volume and a reversal candle forms.
Entry: Long when price forms a bullish reversal (hammer/inside-bar) with a close back above the pullback candle.
Stop-loss: Below the pullback low (or below S2 if a larger stop is justified).
Target: VWAP then R1; if momentum resumes, trail toward R2/R3.
Example numeric: Price trending above Weekly VWAP at ₹1,400; pullback to S1 at ₹1,360. Enter long at ₹1,370 when a bullish candle closes; stop at ₹1,350; first target VWAP ₹1,400, second target R1 ₹1,450.
Exit rules and money management
Basic exit hierarchy
Hard stop exit — when price hits initial stop-loss. Always use.
Target exit — take partial profits at R1/R2 (for longs) or S1/S2 (for shorts). Use trailing stops for the remainder.
VWAP invalidation — if you entered long above VWAP and price returns and closes significantly below VWAP, consider exiting (condition depends on timeframe and trade size).
Price action exit — reversal patterns (strong opposite candle, bearish/bullish engulfing) near targets or beyond signals to exit.
Trailing rules
After price reaches R2, move stop to breakeven + a small buffer or to VWAP.
After price reaches R3, trail by 1 ATR or lock a defined profit percentage.
Position sizing & risk
Risk per trade: commonly 0.5–2% of account equity.
Determine position size by RiskAmount ÷ (EntryPrice − StopPrice).
If the stop distance is large (e.g., trading R3 fades), reduce position size.
Filters & confirmation (to reduce false signals)
Volume filter: For breakouts, require volume above short-term average (e.g., >20-period average). Breakouts on low volume are suspect.
Trend filter: Only take breakouts in the direction of the higher-timeframe trend (for example, use Daily/Weekly trend when trading 30m/1H).
Candle confirmation: Prefer entries on close of the confirming candle (not intrabar noise).
Multiple confirmations: When R1 break happens but RSI/plotted momentum indicator does not confirm, treat signal as lower probability.
Special considerations for timeframe-aware logic
On 30m/1H the script uses Weekly VWAP/bands. That means band levels change only on weekly candles — they are strong, structural levels. Treat R1/R2/R3 as significant and expect fewer, stronger signals.
On Daily, the script uses Monthly VWAP/bands. These are wider; trades should allow larger stops and smaller position sizes (or be used for swing trades).
On other intraday charts you get session VWAP (useful for intraday scalps).
Example: If you trade 1H and the Weekly R1 is at ₹2,400 while session VWAP is ₹2,350, a close above Weekly R1 represents a weekly-level breakout — prefer that for swing entries rather than scalps.
Example trade walkthrough (step-by-step)
Context: 1H chart, auto-mapped → Weekly VWAP used.
Weekly VWAP = ₹3,000; R1 = ₹3,080; R2 = ₹3,150.
Price consolidates below R1. A large bullish candle closes at ₹3,085 with volume 40% above the 20-bar average.
Entry: Buy at close ₹3,085.
Stop: Place stop at ₹2,995 (just under Weekly VWAP). Risk = ₹90.
Position size: If risking ₹900 per trade → size = 900 ÷ 90 = 10 units.
Targets: Partial take-profit at R2 = ₹3,150; rest trailed with stop moved to breakeven after R2 is hit.
If price reverses and closes below VWAP within two bars, exit immediately to limit drawdown.
When to avoid trading these signals
High-impact news (earnings, macro announcements) that can gap through bands unpredictably.
Thin markets with low volume — VWAP loses significance when volumes are extremely low.
When weekly/monthly bands are flat but intraday price is volatile without clear structure — prefer session VWAP on smaller timeframes.
Alerts & automation suggestions
Alert on close above R1 / below S1 (use the built-in alertcondition the script adds). For higher-confidence alerts, require volume filter in the alert condition.
Automated order rules (if you automate): use limit entry at breakout close plus a small slippage buffer, immediate stop order, and OCO for TP and SL.

CyberTradingV1.4 TRexCyberTradingV1.3 — Multi-TF Volatility/Structure + FVG Suite (by College Pips)
TL;DR
One utility to read volatility regime (ATR vs TH), map market structure & swings, and track FVG/CE imbalances—so you can gauge range, context and entries in one place. No signals or promises; it’s a contextual toolkit.
What it does
Volatility table (multi-TF): Shows ATR-style and TH proxies across 1m → Monthly, so you can compare current TF vs higher TFs.
Composite levels: LQC / GAM / Trigger / TRex quantify “how much is enough” for legs/impulses relative to the active TF.
Structure & swings: Validated swing highs/lows with optional time-anchored rectangles (height sized by LQC) and auto structure/diagonal lines.
Imbalances (FVG): Auto-detect UP/DOWN FVGs, extend forward, optional CE line; alerts fire on touches/entries/fills.
Candle sizing: Directional color map by fixed ATR-ratio buckets; Inside Bars are force-colored for clarity.
How components work together (mashup rationale)
Read regime with the table (ATR vs TH per TF).
Map structure with swings/lines to see HH/HL/LH/LL context.
Focus imbalances with FVG + optional CE; monitor with alerts.
Act with thresholds using LQC/GAM/Trigger/TRex to standardize expectations across symbols/TFs.
Method transparency
ATR/TH math: ATR is a smoothed multi-window blend; TH scales the daily range to TF via √time.
Composites: LQC ≈ √(ATR×TH) × C(TF); GAM2/3/4 and Trigger/TRex apply TF-specific scalars to min/max aggregates (see source for exact coefficients).
Multi-TF: Values come from request.security and finalize on higher-TF bar close (no look-ahead).
Swings: Confirmed using left/right strengths; labels are offset back to the pivot bar.
FVG/CE: Classic 3-bar definition; CE is the midpoint line. Boxes extend until touched/filled; optional auto-delete on fill.
Usage
Enable the table to gauge expansion/contraction.
Turn on swing rectangles for LQC-sized reaction zones.
Toggle FVG + CE on your execution TF; use alerts to catch re-entries/resolutions.
Combine with price action and your own trade plan.
Limitations & fair warnings (be honest)
Offsets/past plotting: Swing labels and rectangles are anchored to past bars (offset = -right_strength). They do not predict future bars.
Repainting notes: Swings confirm after right_strength bars; higher-TF values finalize on their close. Past markings can update as confirmations occur.
Tick handling: Uses syminfo.mintick (special cases for JPY/XAU/XAG). Validate on exotic symbols.
No promises: This is a context tool, not a buy/sell signal generator.
Alerts included
ABOVE/BELOW threshold: Price crossing CE or FVG bounds.
IOFED up/down: Price entering an FVG from above/below.
Inputs (high-level)
Layout/positioning, color palettes, swing rectangle styling (width/fill/border), detection strengths, label/line widths, FVG lookback, CE on/off & style, auto-delete filled boxes.
Credits & reuse
Concepts like FVG/CE are widely known in market-microstructure education.
This implementation—table architecture, LQC/GAM/Trigger framework, swing rectangles, candle bucketing, and alert logic—is original to College Pips / CyberTradingV1.4

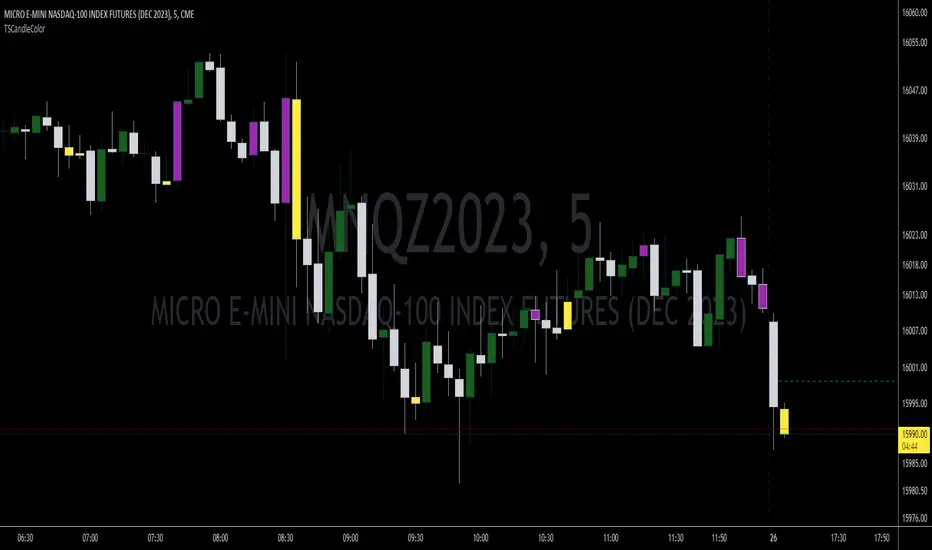
TSCandleColor (The Strat)This indicator highlights 1 and 3 candles based on The Strat, created by Rob Smith. In The Strat, candles can only take one of 3 forms, an inside bar or a '1' where the high and low of the current candle are within the high and low of the previous candle, an outside bar or a '3' where the high and low of the current candle are outside of the previous bar, and a '2' bar where either the high or low of the current candle surpasses the previous candle but not both. Since '1' and '3' bars are key to many setups, this script highlights those candles. Highlighted colors are configurable by the user. This indicator further draws a line at the 50% mark of the previous candle for use in conjunction with the teachings of Sara Strat Sniper and her 50% rule. Her 50% rule states that when a '2' candle passes the 50% mark of the previous candle there is a high likelihood of that '2' candle becoming a '3'. Having this already drawn on the chart with each new candle makes it much easier to see this real-time. The color and style of the 50% line is also configurable.
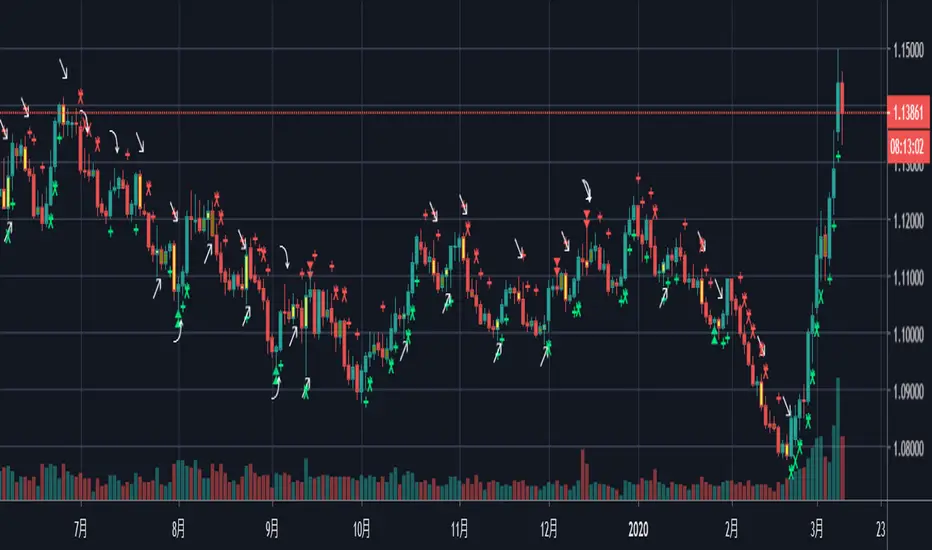
Pullback IndicatorThe Pullback Indicator is a technical analysis tool designed to identify pullbacks in the price action of a financial instrument. It is based on the concept that price tends to retrace to a previous level of support or resistance before continuing in the direction of the trend.
The indicator is plotted as a series of triangles above or below the price bars, depending on the type of pullback detected. A green triangle is displayed when a bullish pullback is detected, while a red triangle is displayed for a bearish pullback.
The Pullback Indicator uses Inside Bar Range, this number is a user-defined input that specifies the number of bars to look back for the highest high and lowest low.
The indicator classifies four types of pullbacks:
Swing Low - When the price forms a lower low and a higher low than the previous bar.
Swing High - When the price forms a higher high and a lower high than the previous bar.
High Low Sweep and close below - When the price forms a lower low and a higher low than the previous bar, but the close is below the previous high.
High Low Sweep and close above - When the price forms a higher high and a lower high than the previous bar, but the close is above the previous low.
The Pullback Indicator is best used in conjunction with other technical analysis tools to confirm the direction of the trend and to identify potential entry and exit points.

The $trat | by Octopu$1️⃣2️⃣3️⃣ The $trat | by Octopu$
The $trat: The Strat by Octopu$
Absolute Solution for The Strat Traders!
The Strat is a Strategy created by Rob Smith's and is well known by being an innovative trading system.
Continues to grow in popularity as more traders discover this method.
It is a simplified way to understand Price Action. It is based on three principles: Types of candles, 1, 2, and 3.
Other things to be known about The Strat are Actionable Signals and Time Frame Continuity.
The $trat has it all.
This Indicator includes Bar Types (1, 2 and 3) also known as Inside Bars, Twos (Up or Down) and Outside Bars.
It is also well crafted with a built-in Time Frame Continuity (TFC) which shows Price Movement at a glimpse.
On top of that, in the best of both worlds, also comes with information about the Bars Status for other TFs as well.
It means that you can know how another TF of you preference is performing. Right there.
Works in Any Time Frame.
On Any Ticker.
(Using SPY 5m just as an example:)
www.tradingview.com
SPY
Features:
• Candle Types (1, 2 and 3) IB, 2U & 2D and OB.
• Time Frame Continuity (TFC) for Price Movement/Trend Check
• Bar Status shortcut. So you can know Price Action/Direction fast.
• Reversal indicators for Action-taking and Situational Awareness
• Combos Labels. So nothing ever goes unnoticed.
Options:
• Absolutely fully Customizable: Colors, Sizes, Numbers. Everything.
• On/Off Switches for most of the Information and Optionable Selections
• Hammer/Shooter Indicator automatically inserted to Chart
• Candle/Bars Coloring for ease of reading.
• Highlight options for specific setups
Notes:
v1.0
$trat Indicator release
Changes and updates can come in the future for additional functionalities or per requests.
Did you like it? Boost it. Shoot a message! I'd appreciate if you dropped by to say thanks.
- Octopu$
🐙

Dunnigan Bars This displays "Dunnigan Bars," which is defined as:
Higher High and High Low = Green Color
Lower High and Lower Low = Red Color
Inside Bar = Black Color
Outside Bar = Yellow Color

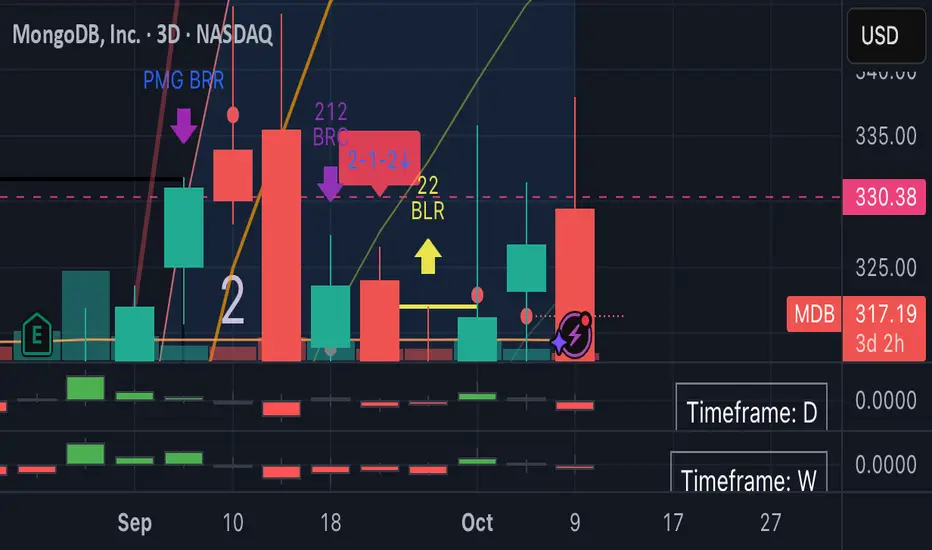
Strat 1-2 Break AlertsThe Strat 1-2 Break Alerts
by Yolanda Marie Dixon
This indicator automatically identifies Inside Bars (1) and alerts when price breaks out into a 2-1-2 Bullish or 2-1-2 Bearish setup — two of the most actionable patterns in The Strat methodology created by Rob Smith.
📊 What It Does:
Marks Inside Bars with a yellow triangle below the candle.
Plots a green “2-1-2↑” triangle when a bullish breakout occurs.
Plots a red “2-1-2↓” triangle when a bearish breakdown occurs.
Provides built-in alerts so traders never miss a 2-1-2 setup.
💡 How to Use It:
Add the indicator to your chart, then go to Alerts → Create Alert → Condition: Strat 1-2 Break Alerts, and choose either 2-1-2 Up or 2-1-2 Down.
Perfect for traders who follow The Strat and want simple, reliable visual and alert-based signals for 1-2 setups.
—
🔔 Stay ready, stay Stratified.
Master The Strat with instant alerts for every 2-1-2 breakout.

2-1-2 ReversalThis indicator identifies all 2-1-2 price action patterns on any chart or time frame — both reversals and continuations — based on Rob Smith’s The Strat trading system.
🟢 Bullish 2-1-2:
Detected when a directional candle (2D or 2U), followed by an inside bar (1), is followed by a break to the upside (2U).
🔴 Bearish 2-1-2:
Detected when a directional candle (2U or 2D), followed by an inside bar (1), is followed by a break to the downside (2D).
✅ Key Features:
Works on any time frame (1m to Monthly)
No filters — shows every valid 2-1-2 setup
Detects both reversal and continuation patterns
🔔 Built-in alert conditions for Bullish and Bearish setups
🔍 Great for strat traders who want to catch all opportunities, not just hand-picked ones
🧠 Use Case Tips:
Combine with higher time frame trend or broadening formations for confirmation
Works well with sectors (SPY, QQQ, XLE) and ETFs for strat alignment
Add volume, EMA, or other custom confluences for advanced filtering
Momentum Analysis Package by JCTThis all-in-one script is designed for traders and investors seeking maximum charting power in a single indicator—especially for those using TradingView’s free plan, where only one or two indicators are allowed per chart tab.
Why This Script Stands Out:
- Unified Solution: Combines most of the popular and essential indicators— EMA, SMA, RS Rating, Buyable Gap Up detection, Pattern Recognition, Inside Bar signals , and more—into one comprehensive package.
- Ideal for Free Users: No need to choose between different overlays or switch scripts; everything you require for detailed technical analysis is now accessible in a single chart tab .
- Pattern Recognition: Robust candlestick , base , cup with handle , and double bottom set-up detection—plus gap up signals —help you spot trade opportunities and monitor market momentum.
Key Features Included:
- Multi-timeframe customizable moving averages (EMA/SMA)
- RS Rating with new high/low detection
- Buyable Gap Up signal identification
- Chart pattern detection
- Bullish/bearish inside bar highlights
Hope you guys do enjoy it!!!

Nexus v10Nexus v10 - Confluence-Driven Trading Indicator
The Nexus v10 is a sleek, modern, and versatile trading indicator that delivers precise buy and sell signals by synthesizing a confluence of technical factors, including Heikin Ashi candles, RSI, ADX, and EMA crossovers. The name "Nexus" captures its core strength—connecting and synthesizing multiple signals into a cohesive trading decision point. The term evokes a central hub or convergence, reflecting the script’s confluence-based approach, dynamic adaptability, and real-time precision for scalping. Designed for traders seeking clarity and efficiency, it’s a powerful tool for navigating dynamic markets.
Key Features:
Confluence-Based Signals: Combines weighted signals from Heikin Ashi, RSI, ADX, and EMA crossovers to generate high-probability buy/sell signals.
Neutral Status Logic: Limits consecutive signals to two per direction, requiring a "Neutral" status before the second signal to ensure disciplined trading.
Clean Visualization: Displays only the two most recent buy/sell signals, keeping the chart uncluttered and focused on current opportunities.
Dynamic Adaptability: Offers customizable RSI thresholds, EMA lengths, MTF settings, and dynamic overbought/oversold levels to fit any market or style.
Candle Coloring & Inside Bars: Highlights overbought/oversold conditions and inside bars with customizable colors for enhanced context.
Real-Time Debug Table: Provides live insights into signal status, RSI, MTF trends, and ADX for informed decision-making.
How It Works:
Nexus v10 integrates multiple technical factors, including MTF analysis (default: 3m, 15m, 240m, D), RSI, ADX, and EMA crossovers, to produce signals when confluence criteria are met. Signals appear as circles on the chart, with a maximum of two visible signals per direction (buy or sell). A second signal in the same direction requires a neutral status, ensuring precision. Ideal for scalping, swing, and trend trading across stocks, forex, futures, and more.
Usage Tips:
Customize settings like RSI thresholds and MTF periods to align with your trading strategy.
Use the debug table to monitor confluence factors and signal status in real-time.
Pair with sound risk management and personal analysis for optimal results.
Note:
Always backtest thoroughly in your trading environment to validate performance. Let the Nexus v10 guide your next trade with precision and clarity!

Haniva ATRHaniva ATR Indicator
This indicator is fully based on ATR (Average True Range) calculations and is designed for analyzing behavior of price movement. It is tailored for traders who follow the BPM style.
Applications of the indicator:
1- Yellow candles represent inside bars, and you can trade them with inside bar hunt setup.
2- The ATR table calculates Average True Range values across multiple timeframes for better volatility assessment.
3- The Stop Loss & Target table provides suggested stop loss and target levels, dynamically calculated based on each timeframe’s ATR.
4- Long shadows (wicks) are highlighted in the chart, and their 50% zones are clearly marked to assist with identifying potential reversal or reaction points.
5- The indicator also defines key percentages used to determine the leg timeframe, helping traders align their setups with market structure.

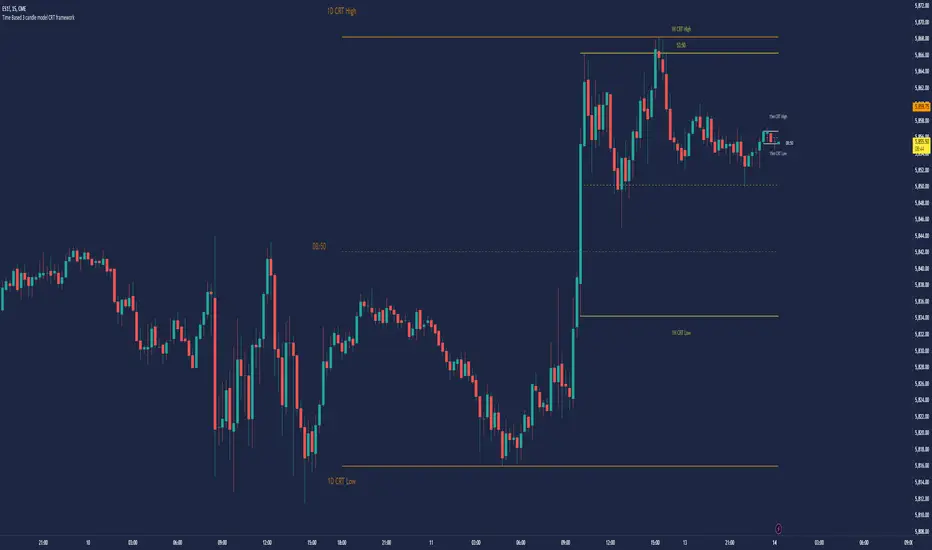
Time Based 3 Candle Model CRT FrameworkThe 3 Candle Model Overview:
The 3 Candle Model serves as a sophisticated framework for traders to navigate the complexities of financial markets, particularly within futures and forex trading. This guide not only elaborates on the model's key features but also emphasizes its originality and practical usefulness in the TradingView community. The core principle of the 3 Candle Model revolves around understanding how candle patterns can represent significant price ranges, offering valuable insights into potential market movements. By integrating the model with other critical trading concepts such as the Power of Three (PO3), Open-High-Low-Close (OHLC), and Turtle Soup setups, traders can enhance their ability to identify high-probability trades and achieve better trading outcomes.
Indicator includes:
3 Customizable Timeframe choices to fractally frame 3 candle models for precision
Live Timers for each timeframe to always be aware of the models timing
Parent Candle tracking on every preffered timeframe until new models parent candle is printed
Key Features of the 3 Candle Model
The 3 Candle Model primarily utilizes a three-candle structure, where the first candle establishes a price range, the second candle may act as a confirmation (often termed a "turtle soup"), and the third candle provides the breakout or continuation. This structure is pivotal in determining entry and exit points for trades, ensuring that each trading decision is backed by solid price action analysis.
OHLC Principle:
The Open-High-Low-Close (OHLC) concept is integral to the 3 Candle Model, allowing traders to analyze price action more effectively. Understanding the relationship between these four price points helps traders gauge market sentiment and potential reversals. By incorporating OHLC into the model, traders can develop a deeper understanding of market structure and its implications for future price movements.
Delivery States:
The 3 Candle Model emphasizes the importance of delivery states, which refer to the market's phase during specific time frames. Recognizing these states aids traders in determining the appropriate conditions for entering trades, particularly when combined with the power of three and candle range patterns. This understanding is crucial for positioning trades in alignment with market momentum.
High Probability Setups:
By aligning the 3 Candle Model with inside bar setups, traders can optimize their strategies for high-probability outcomes. This approach capitalizes on the inherent fractal nature of price movements, where previous patterns repeat at different scales. The combination of the model and inside bar setups enhances the trader's toolkit, allowing for more strategic trade placements.
Turtle Soup Formation:
The 3 Candle Model intricately connects with the Turtle Soup concept, which focuses on false breakouts. Identifying these formations at critical levels enhances the trader's ability to anticipate reversals or continuation patterns. The timing of these setups, particularly during specified times like 3:00 AM, 6:00 AM, 9:00 AM, and 1:00 PM, is crucial for maximizing trade success.
Using the 3 Candle Model in Trading
Integration with PO3:
The Power of Three (PO3) is a fundamental aspect of the 3 Candle Model that emphasizes the significance of three distinct stages of price delivery. Traders can leverage this principle by observing the initial range, confirming patterns, and executing trades during the third phase, leading to higher risk-to-reward ratios. This three-stage approach enhances a trader's ability to make informed decisions based on market behavior.
Targeting Midpoints:
Successful application of the 3 Candle Model involves targeting the midpoints of identified ranges. This practice not only provides strategic entry points but also enhances the probability of reaching desired profit levels. By targeting these midpoints, traders can refine their exit strategies and manage risk more effectively.
Aligning with Market Timing:
Timing is everything in trading. By synchronizing the 3 Candle Model setups with the aforementioned key timeframes, traders can better position themselves to exploit market dynamics. This alignment also facilitates the identification of high-quality trades that exhibit strong potential for profitability.
Prioritizing A+ Setups:
By focusing on the 3 Candle Model and its associated concepts, traders can prioritize A+ setups that exhibit a strong alignment of factors. This methodical approach enhances the quality of trades taken, leading to improved overall performance. By cultivating a strategy centered on high-probability setups, traders can maximize their return on investment.
Ensuring Originality and Usefulness
To meet the TradingView community guidelines, it is essential that this script is both original and useful. The 3 Candle Model, in its essence, is designed to provide traders with a unique perspective on market movements, free from generic or rehashed strategies. This tool integrates unique interpretations of the three-candle model and the associated strategies that are distinctly articulated and innovative.
Practical Applications: there are many practical applications of the 3 Candle Model in various trading contexts. This model in conjunction with other strategies to cultivate high-probability trade setups that can enhance performance across diverse market conditions.
Educational Value: This script is crafted with educational value in mind, providing insights that extend beyond mere trading signals. It encourages users to develop a deeper understanding of market mechanics and the interplay between price action, time, and trader psychology.
Conclusion
The 3 Candle Model provides a comprehensive framework for traders to enhance their trading strategies in the futures and forex markets. By understanding and applying the principles of this model alongside the Power of Three, OHLC concepts, and Turtle Soup formations, traders can significantly improve their ability to identify high-probability trades. The emphasis on timing, delivery states, and alignment of ranges ensures that traders are well-equipped to navigate the complexities of market movements, ultimately leading to more consistent and rewarding trading outcomes.
As trading involves risk, it is essential for traders to utilize these principles judiciously and maintain a disciplined approach to their trading strategies. By adhering to the TradingView community guidelines and emphasizing originality, usefulness, and detailed descriptions, this 3 Candle Model script stands as a valuable resource for traders seeking to refine their skills and achieve greater success in the financial markets.
Through this detailed exploration of the 3 Candle Model, traders will not only learn to recognize and exploit key patterns in price action but also appreciate the interconnectedness of various trading strategies that can significantly enhance their performance and profitability.
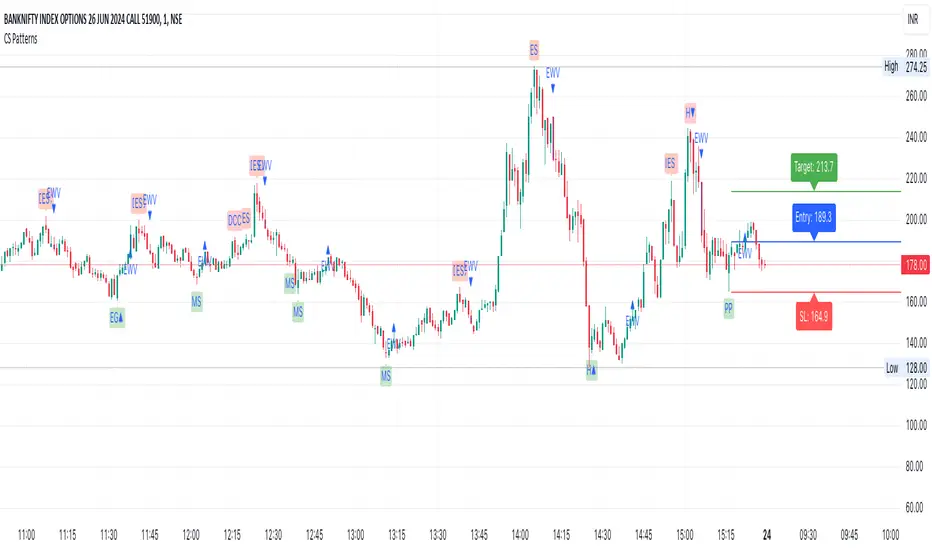
CS PatternsOverview
The CS Patterns indicator is designed to identify and highlight various candlestick patterns on a trading chart. Candlestick patterns are a crucial tool for traders as they help in predicting market movements and potential reversals. This indicator includes single, double, and triple candlestick patterns without revealing the source code, making it an ideal tool for traders who want to utilize advanced pattern recognition while keeping the script proprietary.
Candlestick Patterns Included
Single Candlestick Patterns
Bullish Hammer:
Found at the bottom of a downtrend.
Features a small body, long lower shadow, and little to no upper shadow.
Indicates potential reversal to an uptrend.
Bearish Hanging Man:
Found at the top of an uptrend.
Similar structure to the Bullish Hammer but indicates a potential reversal to a downtrend.
Bullish Inverted Hammer:
Found at the bottom of a downtrend.
Features a small body, long upper shadow, and little to no lower shadow.
Suggests a potential reversal to an uptrend.
Bearish Shooting Star:
Found at the top of an uptrend.
Indicates a potential reversal to a downtrend.
Dragonfly Doji:
Small or non-existent upper shadow and long lower shadow.
Indicates a potential reversal when found at the bottom of a trend.
Gravestone Doji:
Long upper shadow and small or non-existent lower shadow.
Indicates a potential reversal when found at the top of a trend.
Standard Doji:
Very small body, indicates indecision in the market.
Can signal reversals when found at the tops or bottoms of trends.
Long-Legged Doji:
Long upper and lower shadows with a small body.
Indicates a potential market reversal.
Double Candlestick Patterns
Bullish Engulfing:
A smaller bearish candle followed by a larger bullish candle that engulfs it.
Indicates a potential reversal to an uptrend.
Bearish Engulfing:
A smaller bullish candle followed by a larger bearish candle that engulfs it.
Indicates a potential reversal to a downtrend.
Bullish Harami:
A large bearish candle followed by a smaller bullish candle within its range.
Indicates a potential reversal to an uptrend.
Bearish Harami:
A large bullish candle followed by a smaller bearish candle within its range.
Indicates a potential reversal to a downtrend.
Bullish Piercing Line:
A bearish candle followed by a bullish candle that closes above the midpoint of the previous candle.
Indicates a potential reversal to an uptrend.
Bearish Dark Cloud Cover:
A bullish candle followed by a bearish candle that closes below the midpoint of the previous candle.
Indicates a potential reversal to a downtrend.
Bullish Inside Bar:
A smaller bullish or bearish candle completely within the range of the previous bearish candle.
Indicates a potential continuation or reversal to an uptrend.
Bearish Inside Bar:
A smaller bullish or bearish candle completely within the range of the previous bullish candle.
Indicates a potential continuation or reversal to a downtrend.
Triple Candlestick Patterns
Bullish Morning Star:
A bearish candle followed by a smaller-bodied candle (bullish or bearish), and then a larger bullish candle.
Indicates a potential reversal to an uptrend.
Bearish Evening Star:
A bullish candle followed by a smaller-bodied candle (bullish or bearish), and then a larger bearish candle.
Indicates a potential reversal to a downtrend.
How to Use?
Adding the Indicator:
Open TradingView and go to the Pine Script Editor.
Copy and paste the provided code into a new script.
Save and add the script to your chart.
Interpreting the Signals:
The indicator will highlight the patterns on the chart with specific labels.
Use these visual cues to make informed trading decisions based on potential reversals or continuations indicated by the patterns.
Customizing the Settings:
The indicator allows for customization of various settings through input options.
Adjust these settings according to your trading strategy and preferences.
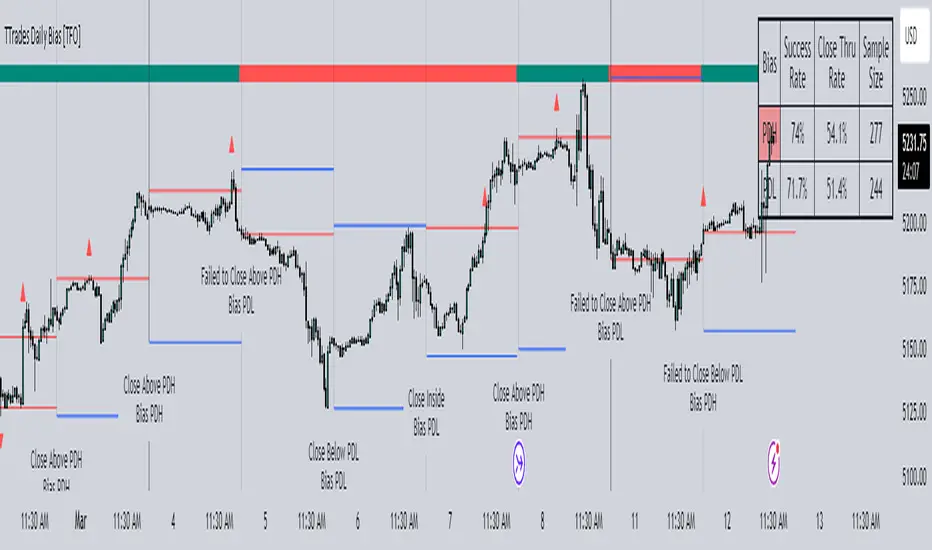
TTrades Daily Bias [TFO]Inspired by @TTrades_edu video on daily bias, this indicator aims to develop a higher timeframe bias and collect data on its success rate. While a handful of concepts were introduced in said video, this indicator focuses on one specific method that utilizes previous highs and lows. The following description will outline how the indicator works using the daily timeframe as an example, but the weekly timeframe is also an included option that functions in the exact same manner.
On the daily timeframe, there are a handful of possible scenarios that we consider: if price closes above its previous day high (PDH), the following day's bias will target PDH; if price trades above its PDH but closes back below it, the following day's bias will target its previous day low (PDL).
Similarly, if price closes below its PDL, the following day's bias will target PDL. If price trades below its PDL but closes back above it, the following day's bias will target PDH.
If price trades as an inside bar that doesn't take either PDH or PDL, it will refer to the previous candle for bias. If the previous day closed above its open, it will target PDH and vice versa. If price trades as an outside bar that takes both PDH and PDL, but closes inside that range, no bias is assigned.
With a rigid framework in place, we can apply it to the charts and observe the results.
As shown above, each new day starts by drawing out the PDH and PDL levels. They start out as blue and turn red once traded through (these are the default colors which can be changed in the indicator's settings). The triangles you see are plotted to indicate the time at which PDH or PDL was traded through. This color scheme is also applied to the table in the top right; once a bias is determined, that cell's color starts out as blue and turns red once the level is traded through.
The table indicates the success rate of price hitting the levels provided by each period's bias, followed by the success rate of price closing through said levels after reaching them, as well as the sample size of data collected for each scenario.
In the above crude oil futures (CL1!) 30m chart, we can glean a lot of information from the table in the top right. First we may note that the "PDH" cell is red, which indicates that the current day's bias was targeting PDH and it has already traded through that level. We might also note that the "PWH" cell is blue, which indicates that the weekly bias is targeting the previous week high (PWH) but price has yet to reach that level.
As an example of how to read the table's data, we can look at the "PDH" row of the crude oil chart above. The sample size here indicates that there were 279 instances where the daily bias was assigned as PDH. From this sample size, 76.7% of instances did go on to trade through PDH, and only 53.7% of those instances actually went on to close through PDH after hitting that level.
Of course, greater sample sizes and therefore greater statistical significance may be derived from higher timeframe charts that may go further back in time. The amount of data you can observe may also depend on your TradingView plan.
If we don't want to see the labels describing why bias is assigned a certain way, we can simply turn off the "Show Bias Reasoning" option. Additionally, if we want to see a visual of what the daily and weekly bias currently is, we can plot that along the top and bottom of the chart, as shown above. Here I have daily bias plotted at the top and weekly bias at the bottom, where the default colors of green and red indicate that the bias logic is expecting price to draw towards the given timeframe's previous high or low, respectively.
For a compact table view that doesn't take up much chart space, simply deselect the "Show Statistics" option. This will only show the color-coded bias column for a quick view of what levels are being anticipated (more user-friendly for mobile and other smaller screens).
Alerts can be configured to indicate the bias for a new period, and/or when price hits its previous highs and lows. Simply enable the alerts you want from the indicator's settings and create a new alert with this indicator as the condition. There will be options to use "Any alert() function call" which will alert whatever is selected from the settings, or you can use more specific alerts for bullish/bearish bias, whether price hit PDH/PDL, etc.
Lastly, while the goal of this indicator was to evaluate the effectiveness of a very specific bias strategy, please understand that past performance does not guarantee future results.
[AlbaTherium] OptiStruct™ Premium for Smart Money Concepts An Insight into Structure Mapping and Order Block Identification with Smart Money Concepts
Introduction:
Structure Mapping & Demands and Supplies Premium serves as a fundamental pillar in the realm of Smart Money Concepts . This indicator adeptly charts the market structure based on a refined version of SMC while identifying Order Blocks. All the concepts embedded in this method are meticulously defined, offering users the ability to chart the market structure with precision and heightened confidence. With this indicator, there is no need for excessive questioning of the accuracy of your markings; it diligently strives to perform this task effectively. There are no hidden 'magic' properties underlying this indicator, ensuring that our users can independently verify each and every feature. It is this commitment to transparency that sets us apart and makes us unique in the market.
In this discussion, we delve into the intricacies of Break of Structure, Change of Character , and SMART MONEY TRAP . We also introduce the concepts of Extreme Order Blocks, Decisional Order Blocks , and Smart Money Trap Order Blocks .
Chapter 1: Understanding Structure Mapping:
Let's begin with some definitions:
- Inside bars are candles that lie within the range of a preceding candle.
- Pullbacks occur in an uptrend when the low of a preceding candle's range (excluding inside bars ) is breached, and the price continues to rise.
- Inducements (IDM) are price levels defined as the low of the latest pullback before the most recent high. They often act as liquidity points that the market revisits before continuing its move.
Break of Structure (BoS):
In an uptrend, after surpassing an IDM , the most recent high becomes a Confirmed structure high, or a Major High . If the price then closes above this Major High, a Bullish Break of Structure (Bullish BoS) is confirmed. Similarly, the lowest point between these movements becomes a Confirmed structure low or Major Low in a downtrend.
Change of Character (ChoCh):
In an uptrend, if the price falls below a Major Low, it indicates a shift in market bias from Bullish to Bearish, or a Bearish Change of Character .
Example of a bullish ChoCh:
Chapter 2: The Significance of Order Blocks:
Order Blocks (OB) play a pivotal role in Smart Money Concepts during entry points. Understanding what they represent and how to identify them is essential. For a Bullish/Bearish Order Block to be confirmed, specific conditions, including price imbalance and breaching the previous candle's high or low, must be met. We will delve into the finer details of identifying and trading Order Blocks, with an emphasis on the fact that price often reacts from Decisional Order Blocks, Extreme Order Blocks , and Smart Money Trap Order Blocks .
An OB is the initial candle range of a pullback that creates a Fair value gap.
These are zones where proactive traders enter the market, resulting in significant price changes indicated by Fair value gaps. It is believed that when the price revisits these zones in the future, it tends to bounce back. This property makes Order Blocks excellent potential entry points.
Order Blocks are categorized as follows:
- Extreme OB : The first and lowest OB between the Major Low and Major High.
- Decisional OB : The most recent OB lower than the current IDM.
- Smart Money Traps : All OBs between Extreme and Decisional OB.
- Demand above IDM / Supply below IDM
Chapter 3: Understanding SMART MONEY TRAP (SMT):
SMART MONEY TRAP is a concept that brings clarity to the distinction between Structure and Order Blocks within Smart Money Concepts and is a unique feature of this indicator. While many Smart Money Traders base their trades on Structure and Order Blocks, it's crucial to recognize that Order Blocks serve as an additional confirmation for buy or sell decisions. Blindly trading based on Order Blocks is not advisable. Instead, traders should exercise patience and await other confirmations like inducement or Liquidity sweep before executing trades on Order Blocks. We will illustrate how this concept works in practice.
In the example above, the market made a high wick up, taking out the buy-side liquidity, then made a bearish ChoCh. We place our sell order on the order block above IDM. This presents a promising trading opportunity, with a stop loss placed above the OB and a take profit set at the low of previous structure.
Conclusion:
Structure Mapping & Demands and Supplies Premium as the epitome of Smart Money Concepts, presenting traders with a tool meticulously crafted for an exceptional user experience . This indicator integrates structural mapping and Order Blocks, providing not only a wealth of knowledge but a platform tailor-made for personalization to suit your unique style and preferences. By mastering the nuances of Impulsive Moves and Corrections, and expertly identifying and trading Order Blocks while considering the SMART MONEY TRAP, traders gain a distinct advantage in the ever-evolving financial markets.
This document serves as an enriching guide to Structure Mapping & Demands and Supplies Premium, accentuating its pivotal role within the Smart Money Concepts framework. We invite users to immerse themselves in an experience that transcends the ordinary, delving into the intricacies that define successful trading. As you navigate the complexities of the market, these detailed insights become your compass, providing a rich and customizable user experience that unlocks the full potential of Smart Money Concepts. Embrace these tools judiciously, and empower your daily analysis with a wealth of information that truly holds its weight in gold.

[AlbaTherium] Structure Mapping with Demand & Supply Zones Structure Mapping v3.0 with Demand & Supply Zones
Introduction:
Structure Mapping v3.0 with Demand & Supply Zones marks a significant advancement in the realm of technical analysis and trading tools. This latest version of the indicator is designed to offer traders a comprehensive understanding of market structure and key demand and supply zones based on a refined version of Smart Money Concepts. All the concepts integrated into this method are meticulously defined, empowering users to map the market structure with confidence. With this indicator, there's no need to doubt the accuracy of your markings; it performs this task effectively. There are no hidden 'magic' properties underlying this indicator, ensuring that our users can independently verify each and every feature. It is our unwavering commitment to transparency that distinguishes us and makes us unique in the market.
Chapter 1: Understanding Market Structure
1.1 Market Structure Defined:
- Market structure forms the bedrock upon which successful trading strategies are constructed. It encompasses the highs, lows, and significant price levels that shape a market's behavior. Structure Mapping v3.0 provides a clear visualization of market structure, enabling traders to identify crucial support and resistance levels.
1.2 The Power of Structural Analysis:
- Structural analysis is a pivotal component of this indicator. By recognizing the fundamental elements of market structure, traders can make informed decisions regarding trend direction, potential reversals, and optimal entry and exit points.
1.3 Rules for Structure Mapping:
Let's explore some key definitions:
- Inside bars: These are candles that exist within the range of a preceding candle.
- Pullbacks: In an uptrend, a valid pullback occurs when the low of a previous candle's range (excluding inside bars) is breached, and the price continues to rise.
- Inducements (IDM): An inducement is a price level. In an uptrend, it is defined as the low of the latest pullback before the highest high. It is considered a liquidity area, often revisited by the market to access liquidity before continuing its upward movement.
- Break of Structure (BoS): In an uptrend, after surpassing an IDM , the highest high becomes a Confirmed structure high, or a Major High . If the price then closes above this Major High, a Bullish Break of Structure (Bullish BoS) is confirmed. Similarly, the lowest point between these movements becomes a Confirmed structure low or Major Low in a downtrend.
Change of Character (ChoCh):
In an uptrend, if the price falls below a Major Low, it indicates a shift in market bias from Bullish to Bearish, or a Bearish Change of Character.
Example of a bullish ChoCh:
Chapter 2: Demand & Supply Zones
2.1 Introduction to Demand & Supply Zones:
- Demand and Supply zones are critical areas on a price chart where significant buying or selling pressure is expected. This indicator highlights these zones, enabling traders to anticipate potential price reactions.
2.2 Identifying Demand and Supply Zones:
A Demand or Supply zone is the first candle of a pullback that leaves a Fair value gap.
Classic example of a trade with our indicator:
Conclusion:
Structure Mapping v3.0 with Demand & Supply Zones is a potent tool for traders seeking to gain an advantage in the financial markets. By focusing on market structure and identifying key demand and supply zones, this indicator equips traders with the knowledge they need to make informed decisions. Whether you're a novice or an experienced trader, this tool can enhance your technical analysis and trading strategies in the dynamic world of trading.
This document serves as a comprehensive guide to Structure Mapping v3.0 with Demand & Supply Zones, emphasizing its significance in understanding market dynamics and identifying critical trading zones. Applying these principles in your trading endeavors can lead to improved decision-making and more profitable outcomes.
[AlbaTherium] Structure Mapping & Order Blocks Advanced - Beta An Insight into Structure Mapping and Order Block Identification with Smart Money Concepts
Introduction:
Structure Mapping & Order Blocks Advanced - Beta serves as a fundamental pillar in the realm of Smart Money Concepts . This indicator adeptly charts the market structure based on a refined version of SMC while identifying Order Blocks. All the concepts embedded in this method are meticulously defined, offering users the ability to chart the market structure with heightened confidence. With this indicator, there is no need for excessive questioning of the accuracy of your markings; it diligently strives to perform this task effectively. There are no hidden 'magic' properties underlying this indicator, ensuring that our users can independently verify each and every feature. It is this commitment to transparency that sets us apart and makes us unique in the market.
In this discussion, we delve into the intricacies of Break of Structure , Change of Character , and SMART MONEY TRAP . We also introduce the concepts of Extreme Order Blocks , Decisional Order Blocks , and Smart Money Trap Order Blocks .
Chapter 1: Understanding Structure Mapping:
Let's begin with some definitions:
- Inside bars are candles that lie within the range of a preceding candle.
- Pullbacks occur in an uptrend when the low of a preceding candle's range (excluding inside bars) is breached, and the price continues to rise.
- Inducements (IDM) are price levels defined as the low of the latest pullback before the most recent high. They often act as liquidity points that the market revisits before continuing its move.
- Break of Structure (BoS):
In an uptrend, after surpassing an IDM , the most recent high becomes a Confirmed structure high, or a Major High . If the price then closes above this Major High , a Bullish Break of Structure (Bullish BoS) is confirmed. Similarly, the lowest point between these movements becomes a Confirmed structure low or Major Low in a downtrend.
- Change of Character (ChoCh):
In an uptrend, if the price falls below a Major Low , it indicates a shift in market bias from Bullish to Bearish, or a Bearish Change of Character .
Example of a bullish ChoCh :
Chapter 2: The Significance of Order Blocks:
Order Blocks (OB) play a pivotal role in Smart Money Concepts during entry points. Understanding what they represent and how to identify them is essential. For a Bullish/Bearish Order Block to be confirmed, specific conditions, including price imbalance and breaching the previous candle's high or low, must be met. We will delve into the finer details of identifying and trading Order Blocks, with an emphasis on the fact that price often reacts from Decisional Order Blocks, Extreme Order Blocks , and Smart Money Trap Order Blocks .
- An OB is the initial candle range of a pullback that creates a Fair value gap .
These are zones where proactive traders enter the market, resulting in significant price changes indicated by Fair value gaps . It is believed that when the price revisits these zones in the future, it tends to bounce back. This property makes Order Blocks excellent potential entry points.
Order Blocks are categorized as follows:
- Extreme OB : The first and lowest OB between the Major Low and Major High.
- Decisional OB : The most recent OB lower than the current IDM.
- Smart Money Traps : All OBs between Extreme and Decisional OB.
- Demand above IDM / Supply below IDM
Chapter 3: Understanding SMART MONEY TRAP (SMT):
SMART MONEY TRAP is a concept that brings clarity to the distinction between Structure and Order Blocks within Smart Money Concepts and is a unique feature of this indicator. While many Smart Money Traders base their trades on Structure and Order Blocks, it's crucial to recognize that Order Blocks serve as an additional confirmation for buy or sell decisions. Blindly trading based on Order Blocks is not advisable. Instead, traders should exercise patience and await other confirmations like inducement or Liquidity sweep before executing trades on Order Blocks. We will illustrate how this concept works in practice.
In the example above, the market largely disregards all the SMT s and responds favorably to the Extreme OB . This presents a promising trading opportunity, with a stop loss placed below the OB and a take profit set at the fill of the Fair value gap.
Conclusion:
Structure Mapping & Order Blocks Advanced - Beta embodies the essence of Smart Money Concepts , serving as a powerful tool for traders. This indicator effectively combines the elements of structure mapping and Order Blocks to guide trading decisions. By comprehending the dynamics of Impulsive Moves and Corrections, distinguishing between Bearish and Bullish Order Flow, and mastering the identification and trading of Order Blocks while considering SMART MONEY TRAP, traders can gain a competitive edge in the dynamic landscape of financial markets.
This document serves as a comprehensive guide to Structure Mapping & Order Blocks Advanced - Beta, highlighting its significance within the Smart Money Concepts framework. It is essential to apply these concepts judiciously to enhance trading.

Engulfing and emaThis is a Pine Script script that helps you see the Engulfing Candlestick and Inside Bar (Boring Candle) candle patterns on the TradingView chart, as well as drawing two Exponential Moving Averages (EMA). Here's a simple explanation:
1. **Candle Pattern**:
- This script identifies the Engulfing Candlestick pattern, which indicates potential changes to the price. If this pattern is detected, the script will show a green (for buy) or red (for sell) arrow above or below that candle.
- The script also identifies the Inside Bar (Boring Candle), which indicates the period area in the market. This candle will be the color you choose (default is orange).
2. **Moving Average (EMA)**:
- This script also plots two Exponential Moving Averages (EMA) on the chart. EMA is a tool that helps you see price trends more clearly.
3. **Risk Management**:
- This script calculates the Stop Loss (SL) and Take Profit (TP) levels for each Engulfing pattern. This helps you manage your trading risks.
- Labels are displayed on the charts for SL and TP, so you know where to place them.
With the help of this script, you can easily identify important patterns in the market and manage your risks better. Make sure to choose a demo account before using it in real trading.
